决策边界
在分类问题上经常会遇到一个名词 - 决策边界。对它有一些了解但是没有很多的认识,同时很难直观去理解高维数据分类问题的决策边界
理清决策边界的概念,同时可视化决策边界
什么是决策边界
对于二分类问题,如果在向量空间中存在一个能够分类数据集的超曲面(hypersurface),使得同一类的数据点在超曲面的同一边,称该超曲面为决策边界(decision boundary)或决策曲面(decision surface)
什么是超平面
超平面是维度比向量空间维度小1的线性子空间,比如3维向量空间的超平面是2维,2维向量空间的超平面是1维
超平面的另一种解释是它的自由度比向量空间维度小1,比如在3维向量空间的2维超平面上,给定(x,y,z)中的任意两点就能确定剩余一点的值
超平面的数学形式如下:
对于二维空间,超平面就是一条直线:
对于三维空间,超平面就是一个平面:
推广到
简写成:
线性 vs. 非线性
如果决策边界是一个超平面(hyperplane),那么称该分类问题为线性可分的,分类器是线性分类器(linear classifier),反之称之为非线性分类器(nonlinear classifier)
常用线性和非线性分类器
线性分类器
- 对于线性SVM分类器而言,其前向操作就是一个线性映射,所以它是线性分类器
- 对于逻辑回归分类器而言,其前向操作是线性映射+
sigmoid函数,其是否线性判定比较复杂,参考logistic回归属于线性模型还是非线性模型?,就我个人观察,虽然sigmoid操作增加了非线性因素,但通常以作为分类面进行分类,也就是说,线性映射结果就决定了分类结果,那么可以看成是线性分类器 - 对于softmax分类器而言,其是逻辑回归对于多分类问题的推广,参考Softmax classifier,同样可看成是线性分类器
非线性分类器
- 对于神经网络而言,如果没有隐藏层,那么就是一个线性分类器;如果有多个隐藏层就是非线性分类器
- 对于KNN分类器而言,其分类标准基于训练数据和测试数据的像素差异,不存在分类超平面,所以是非线性分类器
决策边界可视化
可视化决策边界能够有助于算法的理解和改进,实现方式可分为两类:
单线决策边界:使用一条数据线分隔不同类区域
基于轮廓的决策边界:利用不同颜色的轮廓包围数据点区域
单线决策边界
这种方式适用于线性分类器,以逻辑回归分类器为例,其类实现地址:lr_classifier.py
数据集scores.csv包含100名学生在2次考试中获得的分数和标签,下载链接
- https://github.com/navoneel1092283/logistic_regression.git
- https://download.csdn.net/download/u012005313/11384178
1 | # -*- coding: utf-8 -*- |
实现步骤如下:
- 加载数据
- 训练逻辑回归分类器
- 编辑网格,预测结果
- 绘制轮廓图以及散点图

基于轮廓的决策边界
两类数据决策边界
从上面可知,使用单线决策边界无法实现非线性数据分类,下面使用神经网络分类器实现基于轮廓的决策边界。参考上述实现,替换分类器为神经网络分类器即可
1 | # -*- coding: utf-8 -*- |

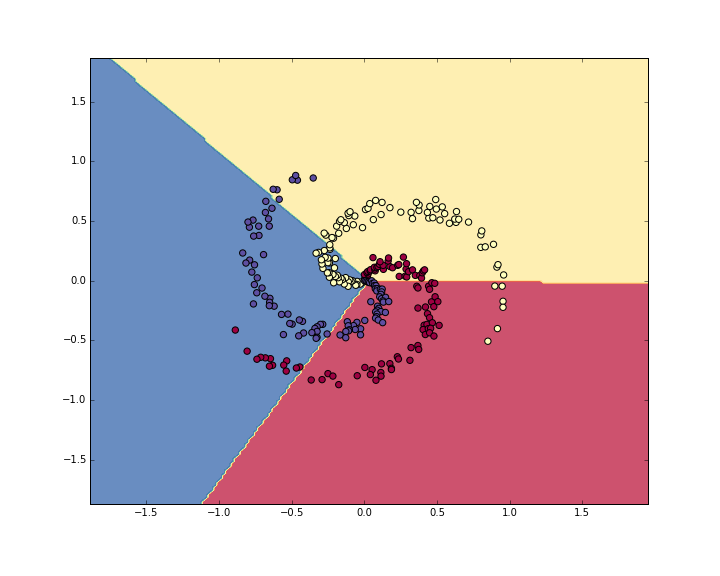
多类数据决策边界
cs231n中提供了一个神经网络测试:Putting it together: Minimal Neural Network Case Study,里面实现了3类数据集的分类,并绘制了决策面
数据集是自定义得到的3类数据,每类个数为100,维度为2
1 | def load_data(): |
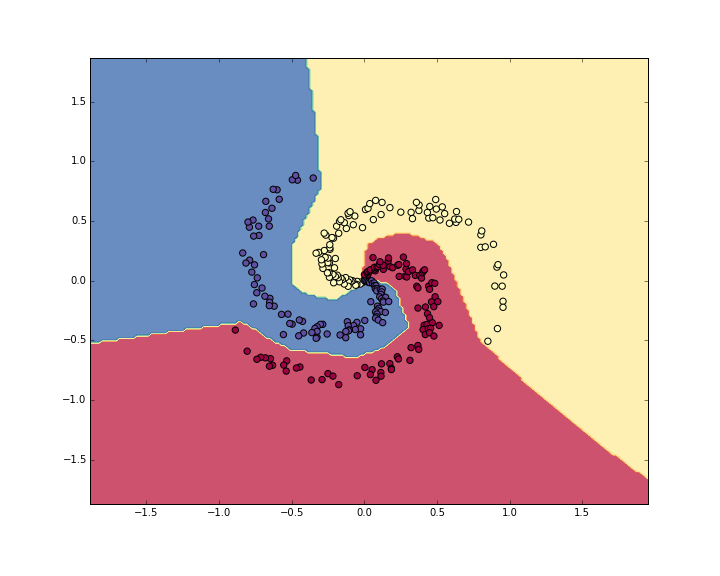
使用softmax分类器实现结果:
使用2层神经网络(隐藏层神经元个数为100),学习率为1e-0,正则化强度为1e-3,共训练10000轮
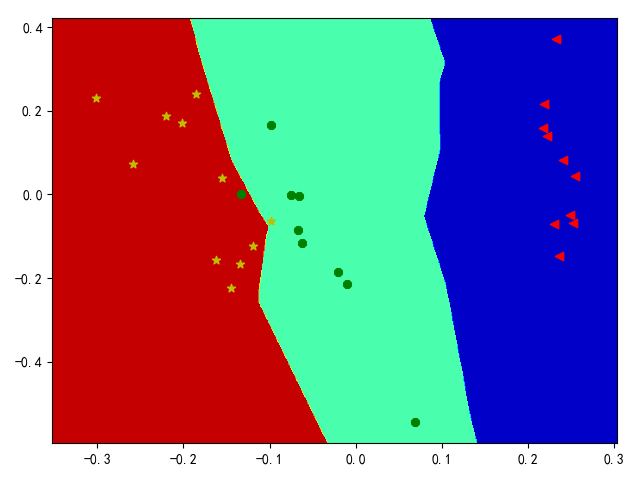
多维数据决策边界
如果数据集维度为多维,需要进一步降维才能进行决策边界可视化。有两种方式进行降维操作:
1.利用随机森林分类器等给特征进行重要性评分,得到2个最重要的特征,然后在散点图上绘制决策边界。
2.主成分分析(PCA)或线性判别分析(LDA)等降维技术可用于将N个特征嵌入到2个特征中,从而将N个特征的信息解释或减少为2个特征(n_components = 2)。然后再基于这两个特征在散点图上绘制决策边界。
使用Iris数据集进行测试,其包含3类数据,数据维度为4,参考:iris数据集
参考主成分分析,实现PCA降维操作,完整代码如下:
1 | # -*- coding: utf-8 -*- |