1
2
3
4
5
6
7
8
9
10
11
12
13
14
15
16
17
18
19
20
21
22
23
24
25
26
27
28
29
30
31
32
33
34
35
36
37
38
39
40
41
42
43
44
45
46
47
48
49
50
51
52
53
54
55
56
57
58
59
60
61
62
63
64
65
66
67
68
69
70
71
72
73
74
75
| # -*- coding: utf-8 -*-
"""
@author: zj
@file: iris.py
@time: 2019-12-14
"""
import pandas as pd
import sklearn.utils as utils
from sklearn.model_selection import train_test_split
import numpy as np
import matplotlib.pyplot as plt
def iris_str_to_int(x):
if 'Iris-setosa'.__eq__(x):
return 0
elif 'Iris-versicolor'.__eq__(x):
return 1
else:
return 2
def load_iris_data(data_path, shuffle=True, tsize=0.8):
data_list = pd.read_csv(data_path, header=None, sep=',')
data_array = data_list.values
height, width = data_array.shape[:2]
data_x = data_array[:, :(width - 1)].astype(np.float)
data_y = data_array[:, (width - 1)]
x_train, x_test, y_train, y_test = train_test_split(data_x, data_y, train_size=tsize, test_size=(1 - tsize),
shuffle=shuffle)
y_train = np.array(list(map(lambda x: iris_str_to_int(x), y_train)))
y_test = np.array(list(map(lambda x: iris_str_to_int(x), y_test)))
return x_train, x_test, y_train, y_test
def draw_iris(x_data, y_data, title, xlabel, ylabel):
fig = plt.figure()
x = x_data[y_data == 0]
plt.scatter(x[:, 0], x[:, 1], c='r', marker='<', label='Iris-setosa')
x = x_data[y_data == 1]
plt.scatter(x[:, 0], x[:, 1], c='g', marker='8', label='Iris-versicolor')
x = x_data[y_data == 2]
plt.scatter(x[:, 0], x[:, 1], c='y', marker='*', label='Iris-virginica')
plt.title(title)
plt.xlabel(xlabel)
plt.ylabel(ylabel)
plt.legend()
plt.show()
if __name__ == '__main__':
iris_path = '/home/zj/data/iris-species/iris.data'
x_train, x_test, y_train, y_test = load_iris_data(iris_path, shuffle=True, tsize=0.8)
x_train = x_train.astype(np.double)
x_test = x_test.astype(np.double)
# 计算训练集每个属性的均值和方差
mu = np.mean(x_train, axis=0)
var = np.var(x_train, axis=0)
eps = 1e-8
# 将数据变换为均值为0,方差为1的标准正态分布
x_train = (x_train - mu) / np.sqrt(var + eps)
x_test = (x_test - mu) / np.sqrt(var + eps)
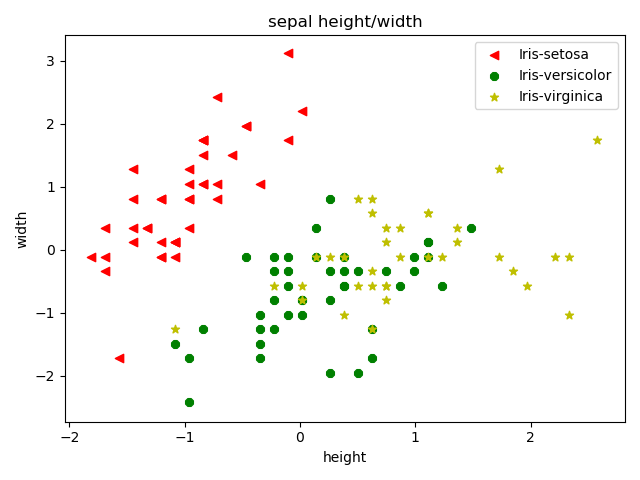
draw_iris(x_train[:, :2], y_train, 'sepal height/width', 'height', 'width')
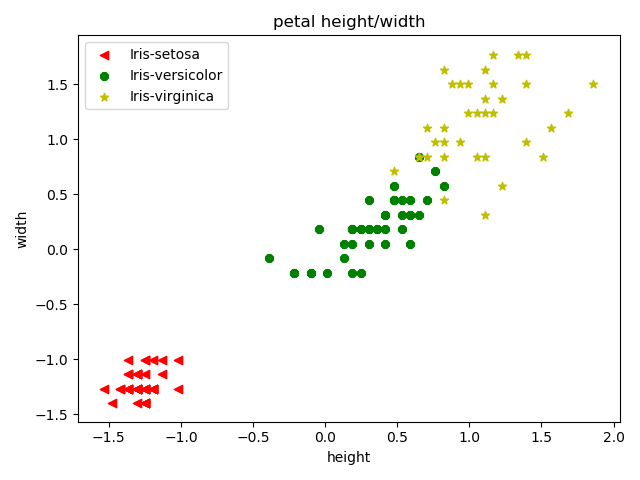
draw_iris(x_train[:, 2:], y_train, 'petal height/width', 'height', 'width')
|