首先利用numpy实现梯度下降解决多变量线性回归问题,然后逐步将操作转换成pytorch
实现步骤如下:
加载训练数据
初始化权重
计算预测结果
计算损失函数
梯度更新
重复3-5步,直到完成迭代次数
绘制损失图
多变量线性回归测试数据参考ex1data2.txt
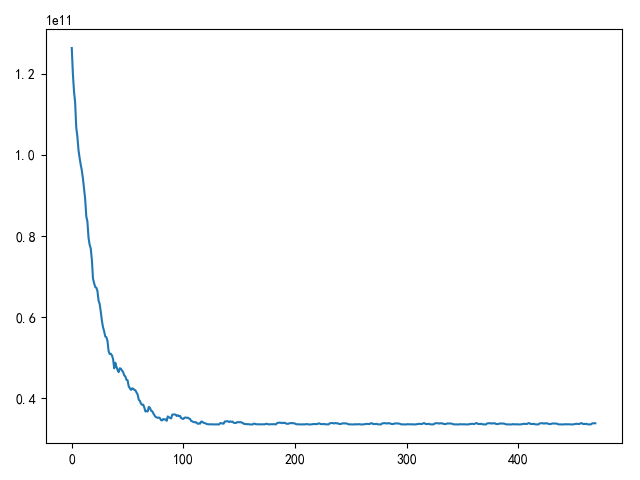
numpy实现随机梯度下降 随机梯度下降 实现如下
1
2
3
4
5
6
7
8
9
10
11
12
13
14
15
16
17
18
19
20
21
22
23
24
25
26
27
28
29
30
31
32
33
34
35
36
37
38
39
40
41
42
43
44
45
46
47
48
49
50
51
52
53
54
55
56
57
58
59
60
61
62
63
64
65
66
67
68
69
70
71
72
73
74
75
76
77
78
79
80
81
82
83
84
# -*- coding: utf-8 -*- # @Author : zj """ 梯度下降法计算线性回归问题 """ import matplotlib.pyplot as plt import numpy as np def load_ex1_multi_data(): """ 加载多变量数据 """ path = '../data/coursera2.txt' datas = [] with open(path, 'r') as f: lines = f.readlines() for line in lines: datas.append(line.strip().split(',')) data_arr = np.array(datas) data_arr = data_arr.astype(np.float) X = data_arr[:, :2] Y = data_arr[:, 2] return X, Y def draw_loss(loss_list): """ 绘制损失函数值 """ fig = plt.figure() plt.plot(loss_list) plt.show() def init_weight(size): """ 初始化权重,使用均值为0,方差为1的标准正态分布 """ return np.random.normal(loc=0.0, scale=1.0, size=size) def compute_loss(w, x, y): """ 计算损失值 """ n = y.shape[0] return (x.dot(w) - y).T.dot(x.dot(w) - y) / n def using_stochastic_gradient_descent(): """ 随机梯度下降 """ x, y = load_ex1_multi_data() extend_x = np.insert(x, 0, values=np.ones(x.shape[0]), axis=1) w = init_weight(extend_x.shape[1]) # print(w) print(w.shape) # 打乱数据 np.random.shuffle(extend_x) print(extend_x.shape) print(y.shape) n = y.shape[0] epoches = 10 alpha = 1e-8 loss_list = [] for i in range(epoches): for j in range(n): temp = w - alpha * (extend_x[j].dot(w) - y[j]) * extend_x[j].T / 2 w = temp loss_list.append(compute_loss(w, extend_x, y)) draw_loss(loss_list) if __name__ == '__main__': using_stochastic_gradient_descent()
pytorch实现批量梯度下降 pytorch使用tensor作为数据保存结构,使用函数from_numpy可以将numpy array数组转换成tensor类型
1 torch.from_numpy(X), torch.from_numpy(Y)
使用torch.randn可以生成符合标准正态分布的随机数组,用于生成权重和偏置值
1 torch.randn(h, 1, requires_grad=True, dtype=torch.double), torch.randn(1, requires_grad=True, dtype=torch.double)
pytorch内置了autograd包,计算预测结果和损失函数后,调用函数backward()就能够自动计算出梯度
首先需要开启权重和偏置值的梯度开关,然后在调用函数后进行梯度更新
1
2
3
4
5
with torch.no_grad(): w -= w.grad * lr b -= b.grad * lr w.grad.zero_() b.grad.zero_()
使用torch.no_grad能够保证梯度更新过程中不再计算梯度值,计算完成后需要将梯度归零,避免下次叠加
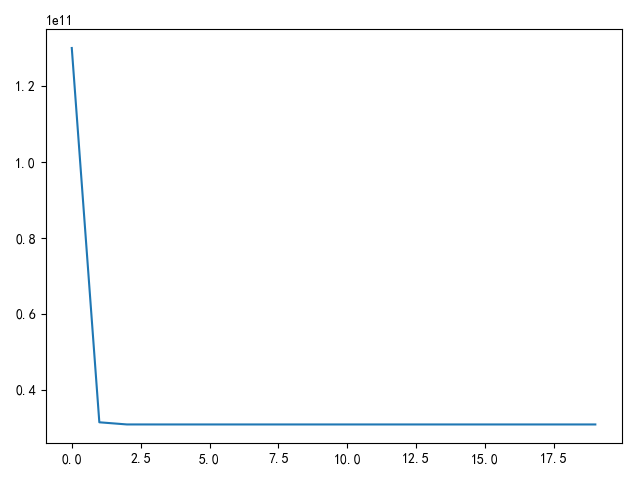
使用pytorch实现批量梯度下降 计算多变量线性回归问题
1
2
3
4
5
6
7
8
9
10
11
12
13
14
15
16
17
18
19
20
21
22
23
24
25
26
27
28
29
30
31
32
33
34
35
36
37
38
39
40
41
42
43
44
45
46
47
48
49
50
51
52
53
54
55
56
57
58
59
60
61
62
63
64
65
66
67
68
69
70
71
72
73
74
75
76
77
78
79
80
81
82
83
84
85
86
87
88
89
90
91
92
93
# -*- coding: utf-8 -*- # @Author : zj """ 梯度下降法计算线性回归问题 """ import matplotlib.pyplot as plt import numpy as np import torch def load_ex1_multi_data(): """ 加载多变量数据 """ path = '../data/coursera2.txt' datas = [] with open(path, 'r') as f: lines = f.readlines() for line in lines: datas.append(line.strip().split(',')) data_arr = np.array(datas) data_arr = data_arr.astype(np.float) X = data_arr[:, :2] Y = data_arr[:, 2] return torch.from_numpy(X), torch.from_numpy(Y) def init_weight(h): """ 初始化权重,使用均值为0,方差为1的标准正态分布 """ return torch.randn(h, 1, requires_grad=True, dtype=torch.double), torch.randn(1, requires_grad=True, dtype=torch.double) def predict_result(w, b, x): """ 预测结果 """ return x.mm(w) + b def compute_loss(w, b, x, y): """ 计算损失值 MSE """ diff = y - predict_result(w, b, x) return torch.sum(diff * diff) / diff.numel() def draw_loss(loss_list): """ 绘制损失函数值 """ fig = plt.figure() plt.plot(loss_list) plt.show() def using_batch_gradient_descent(): """ 批量梯度下降 """ x, y = load_ex1_multi_data() w, b = init_weight(x.shape[1]) epoches = 20 lr = 1e-7 loss_list = [] for i in range(epoches): # 计算损失值 loss = compute_loss(w, b, x, y) # 保存损失值 loss_list.append(loss) # 反向更新 loss.backward() # 梯度更新 with torch.no_grad(): w -= w.grad * lr b -= b.grad * lr w.grad.zero_() b.grad.zero_() draw_loss(loss_list) if __name__ == '__main__': using_batch_gradient_descent()
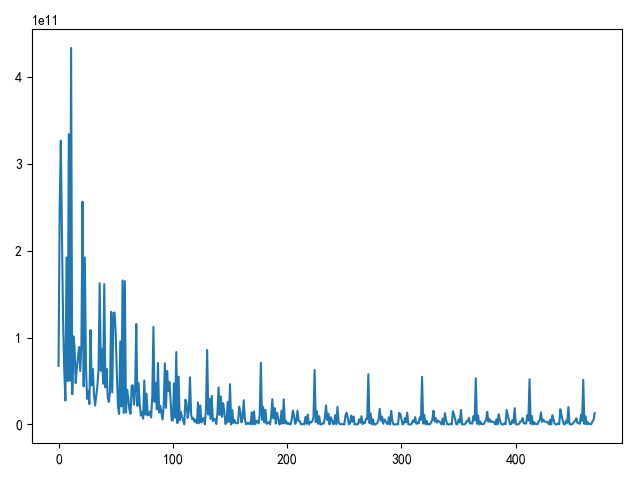
pytorch实现随机梯度下降 pytorch提供了许多类和函数用于计算,下面实现随机梯度下降 解决多变量线性回归
首先在numpy数组转换成pytorch tensor类型前先打乱数据
1
2
3
4
5
# 打乱数据 indexs = np.arange(X.shape[0]) np.random.shuffle(indexs) X = X[indexs] Y = Y[indexs]
pytorch.nn包提供了类Linear用于线性计算
1
2
3
4
5
6
7
# 定义线性模型 model = nn.Linear(x.size()[1], 1) # 获取初始权重和偏置值 w = model.weight b = model.bias # 计算预测结果,计算损失值 diff = y - model(x)
pytorch.nn.function包提供了函数mse_loss用于计算均方误差
也可以使用包装类nn.MSELoss
1
2
3
4
5
6
7
8
9
# 损失函数 loss_fn = F.mse_loss # 计算损失值 loss = loss_fn(model(x), y) # 或者 # 损失函数 criterion = nn.MSELoss() # 计算损失值 loss = criterion(model(x), y)
pytorch.optim提供了类SGD用于计算随机梯度下降
1
2
3
4
5
6
7
8
# 定义优化器 optimizer = optim.SGD(model.parameters(), lr=2e-7, momentum=0.9) # 清空梯度 optimizer.zero_grad() # 计算梯度 loss.backward() # 更新 optimizer.step()
实现如下:
1
2
3
4
5
6
7
8
9
10
11
12
13
14
15
16
17
18
19
20
21
22
23
24
25
26
27
28
29
30
31
32
33
34
35
36
37
38
39
40
41
42
43
44
45
46
47
48
49
50
51
52
53
54
55
56
57
58
59
60
61
62
63
64
65
66
67
68
69
70
71
72
73
74
75
76
77
78
79
80
81
82
83
84
85
86
87
# -*- coding: utf-8 -*- # @Author : zj """ 梯度下降法计算线性回归问题 """ import matplotlib.pyplot as plt import numpy as np import torch import torch.nn as nn import torch.nn.functional as F import torch.optim as optim def load_ex1_multi_data(): """ 加载多变量数据 """ path = '../data/coursera2.txt' datas = [] with open(path, 'r') as f: lines = f.readlines() for line in lines: datas.append(line.strip().split(',')) data_arr = np.array(datas) data_arr = data_arr.astype(np.float) X = data_arr[:, :2] Y = data_arr[:, 2] # 打乱数据 indexs = np.arange(X.shape[0]) np.random.shuffle(indexs) X = X[indexs] Y = Y[indexs] return torch.from_numpy(X).float(), torch.from_numpy(Y).float() def draw_loss(loss_list): """ 绘制损失函数值 """ fig = plt.figure() plt.plot(loss_list) plt.show() def using_stochastic_gradient_descent(): """ 随机梯度下降 """ x, y = load_ex1_multi_data() # 定义线性模型 model = nn.Linear(x.size()[1], 1) # 获取初始权重和偏置值 w = model.weight b = model.bias # 损失函数 criterion = nn.MSELoss() # 定义优化器 optimizer = optim.SGD(model.parameters(), lr=1e-10, momentum=0.9) epoches = 10 loss_list = [] for i in range(epoches): for j, item in enumerate(x, 0): # 计算损失值 loss = criterion(model(item), y[j]) # 清空梯度 optimizer.zero_grad() # 计算梯度 loss.backward() # 更新 optimizer.step() # 保存损失值 loss_list.append(loss) draw_loss(loss_list) if __name__ == '__main__': using_stochastic_gradient_descent()
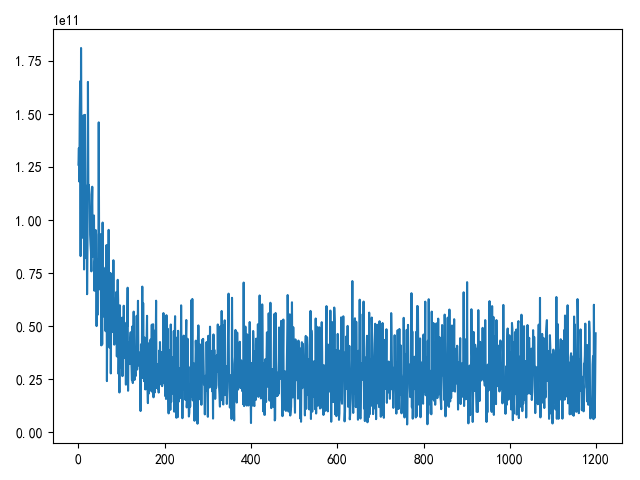
pytorch实现小批量梯度下降 实际训练过程中最常使用的梯度下降方法是小批量梯度下降,
pytorch提供了类torch.utils.data.TensorDataset以及torch.utils.data.DataLoader来实现数据的加载、打乱和批量化
1
2
3
4
5
6
7
batch_size = 8 data_ts = TensorDataset(x, y) data_loader = DataLoader(data_ts, batch_size=batch_size, shuffle=True) for j, item in enumerate(data_loader, 0): inputs, targets = item # 计算损失值 loss = criterion(model(inputs), targets)
实现如下:
1
2
3
4
5
6
7
8
9
10
11
12
13
14
15
16
17
18
19
20
21
22
23
24
25
26
27
28
29
30
31
32
33
34
35
36
37
38
39
40
41
42
43
44
45
46
47
48
49
50
51
52
53
54
55
56
57
58
59
60
61
62
63
64
65
66
67
68
69
70
71
72
73
74
75
76
77
78
79
80
81
82
83
84
85
86
87
88
89
# -*- coding: utf-8 -*- # @Author : zj """ 梯度下降法计算线性回归问题 """ import matplotlib.pyplot as plt import numpy as np import torch import torch.nn as nn import torch.nn.functional as F import torch.optim as optim from torch.utils.data import TensorDataset from torch.utils.data import DataLoader def load_ex1_multi_data(): """ 加载多变量数据 """ path = '../data/coursera2.txt' datas = [] with open(path, 'r') as f: lines = f.readlines() for line in lines: datas.append(line.strip().split(',')) data_arr = np.array(datas) data_arr = data_arr.astype(np.float) X = data_arr[:, :2] Y = data_arr[:, 2] return torch.from_numpy(X).float(), torch.from_numpy(Y).float() def draw_loss(loss_list): """ 绘制损失函数值 """ fig = plt.figure() plt.plot(loss_list) plt.show() def using_small_batch_gradient_descent(): """ 小批量梯度下降 """ x, y = load_ex1_multi_data() batch_size = 8 data_ts = TensorDataset(x, y) data_loader = DataLoader(data_ts, batch_size=batch_size, shuffle=True) # 定义线性模型 model = nn.Linear(x.size()[1], 1) # 获取初始权重和偏置值 w = model.weight b = model.bias # 损失函数 criterion = nn.MSELoss() # 定义优化器 optimizer = optim.SGD(model.parameters(), lr=1e-10, momentum=0.9) epoches = 200 loss_list = [] for i in range(epoches): for j, item in enumerate(data_loader, 0): # print(item) inputs, targets = item # 计算损失值 loss = criterion(model(inputs), targets) # 清空梯度 optimizer.zero_grad() # 计算梯度 loss.backward() # 更新 optimizer.step() # 保存损失值 loss_list.append(loss) draw_loss(loss_list) if __name__ == '__main__': using_small_batch_gradient_descent()
小结 pytorch使用到的类库如下所示
相关阅读


